The function creates a volcano plot of the propeller results and saves it
Usage
plotPropeller(
  data,
  color,
  filename,
  width = 5,
  height = 5,
  FDR = NULL,
  use_permFDP = FALSE,
  dir_output = "."
)
Arguments
- data
A dataframe containing the results from propeller calculation
- color
A vector of colors for the clusters in the plot
- filename
A character representing the file name of the plot
- width
The width of the plot
- height
The height of the plot
- FDR
The FDR threshold for the plot. Required unless use_permFDP = TRUE
- use_permFDP
Logical indicating whether to use permFDP threshold from data (default: FALSE)
- dir_output
directory to save the output plot (default: ".")
Examples
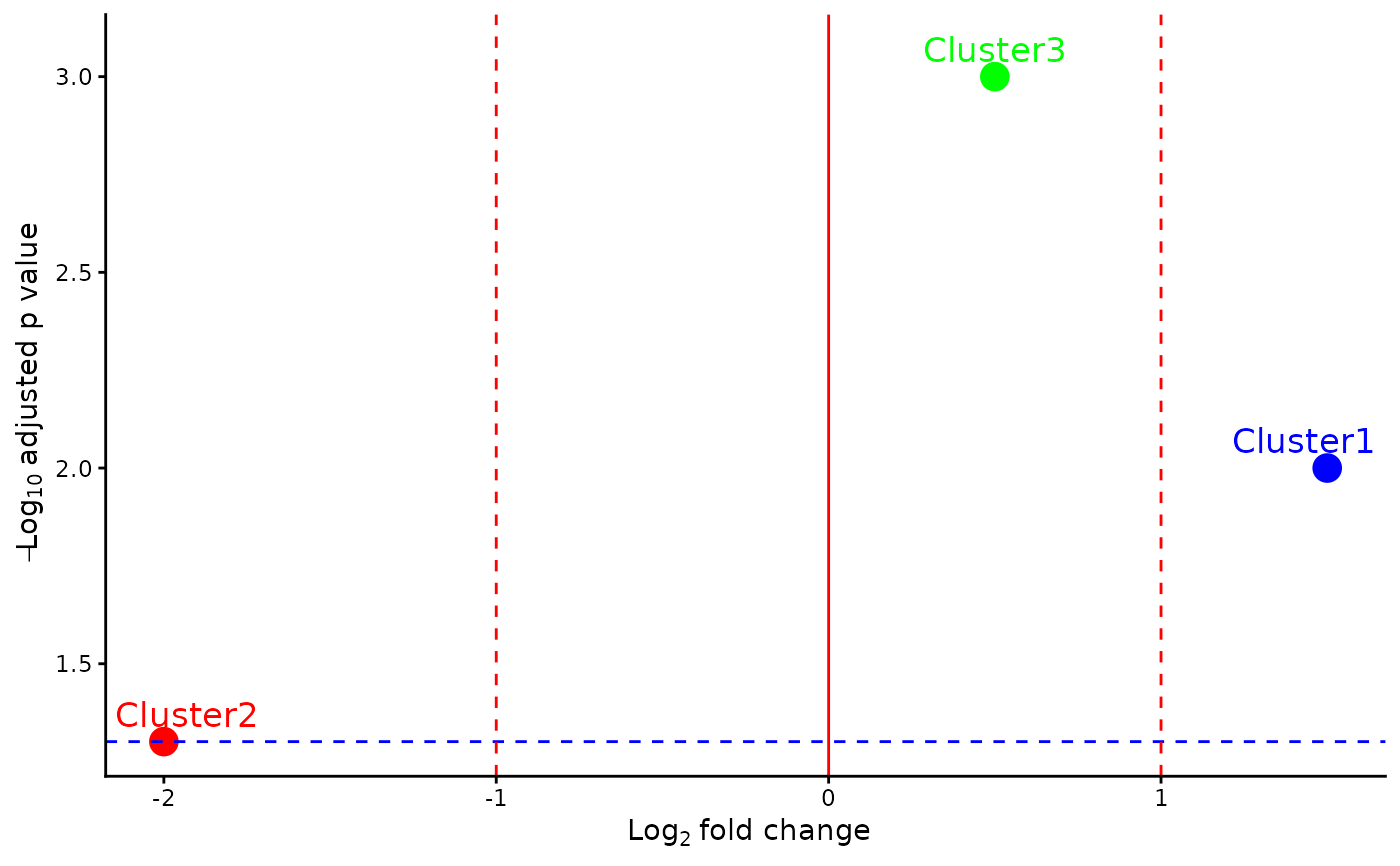
# Standard usage with BH-adjusted FDR
propeller_data <- data.frame(
cluster = c("Cluster1", "Cluster2", "Cluster3"),
log2ratio = c(1.5, -2.0, 0.5),
FDR_log = c(-log10(0.01), -log10(0.05), -log10(0.001))
)
color <- c("Cluster1" = "blue", "Cluster2" = "red", "Cluster3" = "green")
plotPropeller(
data = propeller_data,
color = color,
filename = "test_propeller",
width = 5,
height = 5,
FDR = 0.05,
dir_output = "."
)
 unlink("propeller_test_propeller.pdf")
# With permFDP threshold
propeller_data_permFDP <- data.frame(
cluster = c("Cluster1", "Cluster2", "Cluster3"),
log2ratio = c(1.5, -2.0, 0.5),
P.Value = c(0.01, 0.05, 0.001),
FDR_log = c(-log10(0.01), -log10(0.05), -log10(0.001)),
permFDP_threshold = 0.025
)
plotPropeller(
data = propeller_data_permFDP,
color = color,
filename = "test_propeller_permFDP",
width = 5,
height = 5,
use_permFDP = TRUE,
dir_output = "."
)
#> Using permFDP threshold: 0.025
unlink("propeller_test_propeller.pdf")
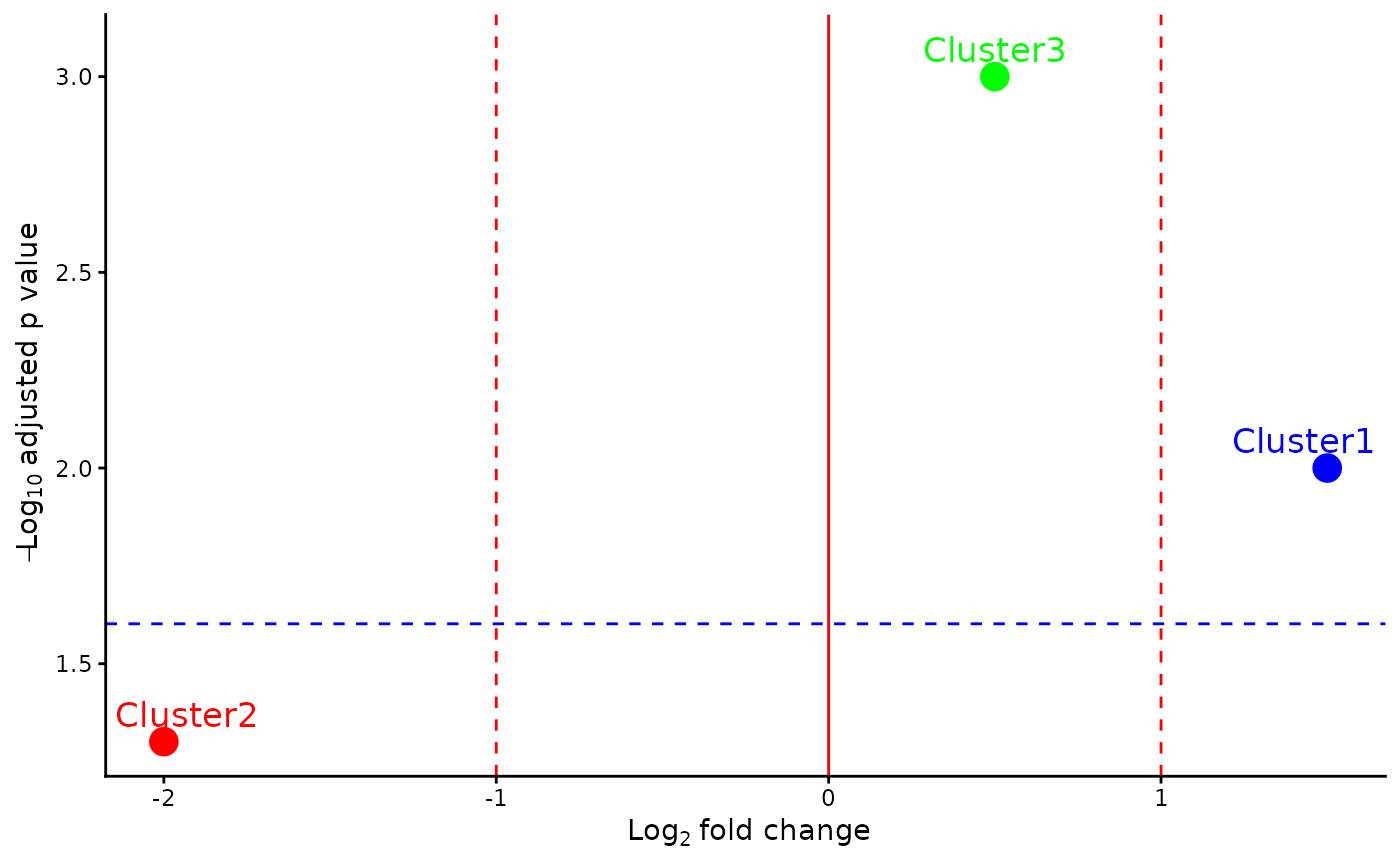
# With permFDP threshold
propeller_data_permFDP <- data.frame(
cluster = c("Cluster1", "Cluster2", "Cluster3"),
log2ratio = c(1.5, -2.0, 0.5),
P.Value = c(0.01, 0.05, 0.001),
FDR_log = c(-log10(0.01), -log10(0.05), -log10(0.001)),
permFDP_threshold = 0.025
)
plotPropeller(
data = propeller_data_permFDP,
color = color,
filename = "test_propeller_permFDP",
width = 5,
height = 5,
use_permFDP = TRUE,
dir_output = "."
)
#> Using permFDP threshold: 0.025
 unlink("propeller_test_propeller_permFDP.pdf")